The Legend of Zelda: Ocarina of Time/Crash Debugger
This is a sub-page of The Legend of Zelda: Ocarina of Time.
The crash debugger is a tool that was used by the developers to figure out what, exactly, had gone wrong when the game crashed. As such, it contains several pages of information detailing what was going on at the time of the crash.
Two versions of the debugger are known to exist. The first version is present and functional in all versions of Ocarina of Time released on the Nintendo 64. This version of the debugger also exists in the Wii Virtual Console releases, but is inaccessible with the code below due to the emulator not mapping D-Pad Left, Down, or Right input to the controller. The second iteration of the debugger is based on the one used in Majora's Mask, and appears in the GameCube versions of Ocarina of Time and Master Quest, however due to a bug (null pointer dereference), the crash debugger crashes as soon as it is launched in these versions, causing a red bar to be displayed. The iQue version has a similar problem.
Additionally, the debugger does not function on most emulators, as they don't redraw the screen after the game has crashed.
Contents
Accessing the Debugger
To trigger the crash debugger, you must first cause the game to trigger a fatal exception. This can be done by exploiting one of Ocarina of Time's various glitches, or by gradually lifting up the left side of the cartridge. Be forewarned, however, as the latter method may damage your game or system. The video below demonstrates how it can be done with that method.
Or, one could choose the more sensible option. When the game crashes, a red or yellow bar will appear in the upper left corner of the screen. A red bar seems to mean that the system is unable to execute the debugger. When you see a yellow bar, input the following key combinations, line by line. Despite popular belief, the input code isn't timed.
- L + R, then while holding both press Z.
- D-Up
- C-Down
- C-Up
- D-Down
- D-Left
- C-Left
- C-Right
- D-Right
- A + B, then while holding both press Start.
Page 0 - HungUp Cause
This page of the debugger is only displayed for certain exceptions. It seems this screen is displayed when a fatal exception occurs, but the faulting thread is not immediately halted. Because of this, the Registers, Stack Dump, and PC Dump pages are not displayed.
Page 1 - Registers
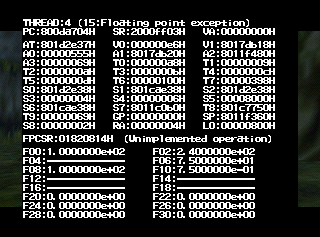
Page 1 provides register information for the System Control Processor (top lines), the main CPU (middle line), and the Floating-Point Unit (bottom lines).
Both Ocarina of Time and Majora's Mask display the same information on the first page of their crash debuggers.
| MIPS Register | Name in crash handler | Notes |
|---|---|---|
| R1 | AT | Reserved for assembler |
| R2-R3 | V0-V1 | Stores results |
| R4-R7 | A0-A3 | Stores arguments |
| R8-R15 | T0-T7 | Temporary registers |
| R16-R23 | S0-S7 | Saved registers |
| R24-R25 | T8-T9 | More temporary registers |
| R28 | GP | Global pointer |
| R29 | SP | Stack pointer |
| R31 | RA | Return address |
Page 2 - Segment Map
Page 2 shows a table used only by the CPU for the purposes of generating display list tasks for the RCP to consume. The Nintendo 64's GPU, the RCP, uses a segment address system to reference data in RAM. The way it works is that the CPU will begin an RCP task by initializing one of the 16 segment addresses to reference some base location on RDRAM, then use a segment offset to refer to data relative to the start of the base address. In Ocarina of Time's case, each segment corresponds to the start address of some file as it's located in RAM. This list does not keep track of all segment addresses, just the ones relevant to the CPU.
| Segment | Identification |
|---|---|
| 2 | Stores the offset to the data of the current scene file in RAM. |
| 3 | Stores the offset to the data of the current map file in RAM. |
| 4 | Stores the offset to the gameplay_keep file in RAM. |
| 5 | Stores the offset to the gameplay_field_keep file (when in the overworld) or gameplay_dangeon_keep (when inside dungeons) file in RAM. |
| 6 | Stores the offset to the current object being processed by the game engine. |
Page 3 - ROM Debug
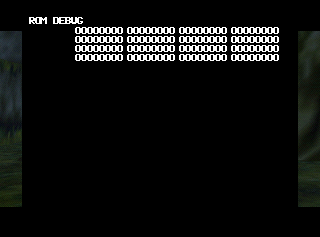
In the retail versions of Ocarina of Time, the values on page 3 are always set to zero.
During testing, however, the developers may have set these values to reflect the content of certain variables during gameplay. This way, when the game crashed, they may have been able to figure out what went wrong by referring to these variable settings.
Page 4 - Stack Dump

|

|

|
Page 4 displays the contents of the crashed thread's stack, a section of memory used to hold temporary data.
The first entry on the far left column shows the current address in memory, while the columns beside it show the information contained at that address. The next most-recent address in memory and its contents are displayed on the line below, and so on and so forth.
Page 5 - PC Dump

|

|

|
Page 5 shows which code was being executed at the time of the crash. Somewhere on the screen is the instruction that failed, as indicated by the Exception Program Counter. Executed code appears at the top of the screen, followed by the faulting code somewhere near the top middle (800DA704 in the above image), with the remaining code being the next sequence to execute.
Page 6 - Actor Overlay List
Page 6 displays a list of actor overlay files currently in memory. Actor overlay files include all dynamic entities that are not structurally part of a map, such as characters, enemies, moving platforms, and any objects Link can interact with.
| No. | RamStart-RamEnd | Offset |
|---|---|---|
| Actor number in decimal. | Where the actor file starts and ends in RAM. | The ROM offset of the actor file. |
Page 7 - Version Info
Page 7 is the most famous screen from the debugger, thanks to its declaration of love to the tester. It also displays the date that the ROM was compiled, which is helpful in determining which version of the game you have. A list of known build dates can be found on the main page: Build Dates.


